US EV Fast Charging — Q1 2025
Paren’s Q1 2025 EV Charging Report highlights key trends in DCFC utilization rates, fast charger reliability, station pricing, and public charge point operator data. Explore shifts in charging network strategies, increasing EV charging session utilization, and how charging station and port infrastructure is growing across high- and low-demand markets. A data-driven look at the evolving fast charging landscape in the Charging 2.0 era.

Report Overview & Highlights
2024 was a year of mixed news in the US DC fast charging (DCFC) industry, but we believe that it will be remembered as a pivotal turn to a new era known as “Charging 2.0.”
On the negative side, the industry saw hardware companies fail or cease US operations, network software providers suddenly pull out of the market, and the headline-grabbing news was Tesla terminating roughly 500 people from the Supercharger team at the end of April 2024. On the positive side, however, we saw continued growth in new deployments of stations and ports, European hardware companies including Alpitronic and Kempower saw traction in the market as new entrants, reliability increased, and the number of NEVI-funded stations opening began to increase at a rapid pace.
In Q1 2025, the industry saw a somewhat typical seasonal decline in both the opening of new fast charging ports and stations — though further affected by a pull-back from Tesla — and a small decline in utilization to 16.2% from 16.6% in Q4 2024. While the overall trend of utilization is increasing significantly, the Q1 period typically sees a slow-down in sessions due to reduced long-distance travel. However, reliability improved, and the average ratio of new ports per station for non-Tesla networks continued on a positive upward trend reaching 3.9 versus 3.6 in Q4 2024 and 2.7 in Q1 2024.
With the growth in deployment from existing and new charging networks/CPOs combined with Tesla’s slight slowdown, CCS ports accounted for 59% of new ports, with 31% being NACS-enabled ports, and a surprising 10% were CHAdeMO. Only 120 of the NACS-cable ports were from non-Tesla networks — showing that the industry is still in the infancy of its transition toward the J3400 charging connector.
Paren is excited to release this first of an on-going series of quarterly reports on the state of the fast-charging industry in the US. This report will continue to grow and evolve with additional data sets and analysis. We hope you find it of great value and welcome feedback and suggestions for improvement or additional types of data, analysis, and segmentation. Please email us at: hello@paren.app
The Paren Team
2024 was a year of mixed news in the US DC fast charging (DCFC) industry, but we believe that it will be remembered as a pivotal turn to a new era known as “Charging 2.0.” — The Paren Team

Charging Infrastructure Expansion
Newly-Opened Stations & Ports Decline in Q1 2025 vs. Q4 2024
Driven by government and utility incentives, private investments, and the entrance of several new charging networks, the total number of public fast charging stations and ports grew steadily over the past 12 months—reaching 10,835 stations and 55,580 ports.
The number of new ports opened, however, decreased significantly in Q1 2025 by 19.9% versus Q4 2024, while the number of new stations declined in Q1 2025 by 22.2% versus Q4 2024.
The decrease in new ports and stations is partially due to a significant slowdown in deployment by Tesla, resulting from the Supercharger team layoffs in April 2024. However, analyzing previous years' data, Q4 has seen the highest number of new ports opened across all CPOs, with the subsequent year's Q1 being the lowest or second lowest quarter of the year. Many CPOs likely work feverishly to deploy new stations before the end of year, and then see a bit of a slow down in the winter portion of Q1. On top of this seasonality, Tesla is now focused more on expanding existing stations over opening new locations.

Ratio of Ports per Station Steadily Increasing
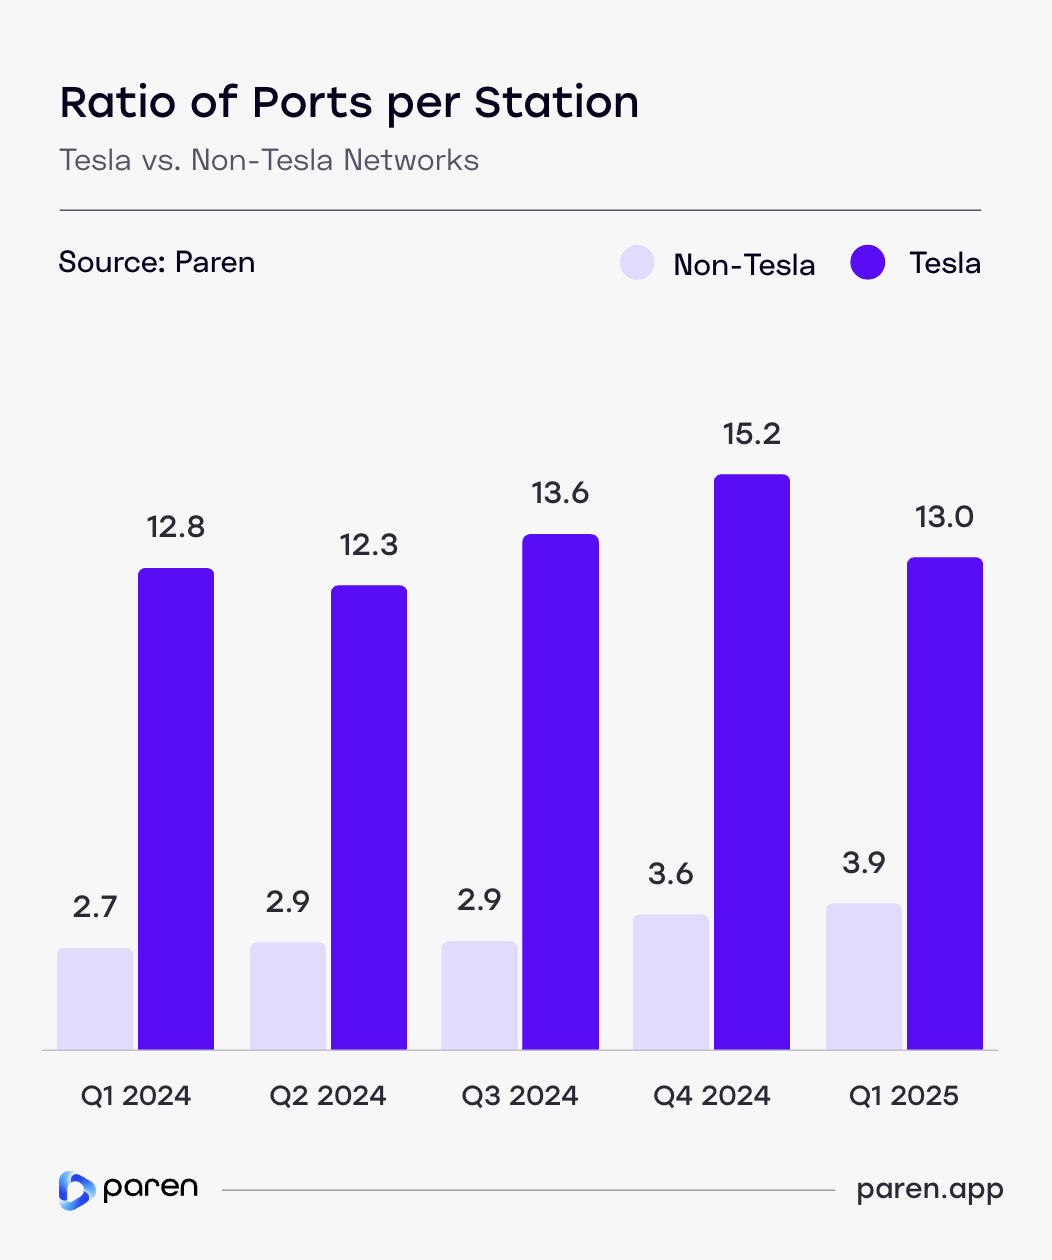
Data from Q1 2025 shows that Tesla stations continue to offer significantly more ports per location than non-Tesla networks, reinforcing the company's strategy of high-density, high-power charging hubs. Meanwhile, non-Tesla charging networks have shown gradual growth in ports per station, increasing accessibility but at a much lower scale compared to Tesla.
Over the past year, Tesla's ports per station have fluctuated each quarter, peaking in Q4 2024 at 15.2 before declining in Q1 2025 to 13.0. This decline is mostly due to Q4 2024 being an outlier with several large-port sites opening that quarter, including a 120-port site in Bartsow, California, a 52-port site in Illinois, and 48-and 38-port sites in Southern California. While Tesla still maintains a significantly higher ports per station ratio compared to non-Tesla networks, the company may increasingly focus on adding additional ports to existing stations, and filling in charging deserts with its typical 8- and 12-port sites.
Non-Tesla networks have steadily increased the average number of ports per station in response to a significant increase in utilization, especially in high-adopting EV markets. In Q1 2025, the average number of ports per station grew to 3.9, a significant increase of 44% from the 2.7 in Q1 2024. Non-Tesla networks are gradually increasing the typical number of ports per station, and closed the gap differential with Tesla to 9.1, from a gap of 10.1 in Q1 2024. On a multiple level, in Q1 2025 Tesla averaged 3.3 times as many ports per station versus non-Tesla networks, down from 4.7 in Q1 2024.
Understanding this metric helps assess whether new stations are being deployed to effectively meet rapidly increasing utilization, especially in busy urban markets with a high concentration of rideshare drivers and EV owners without access to charging where they live. As many CPOs start to rapidly scale their networks, the economics of larger charging stations and hubs is becoming more advantageous.
Deployment of Lower-Power Chargers Jumped in Q1 2025
As EV adoption accelerates, increasing the number and reliability of public fast chargers is critical to instilling confidence among existing and potential new EV buyers. Also key is adding more high-power (e.g., 250 kW and higher) chargers as a growing percentage of EVs can accept power of 250 kW and above, and have improved charging curves. But it is also more cost-effective to add lower-power fast chargers that match long dwell times for drivers enjoying meals at restaurants and shopping malls.
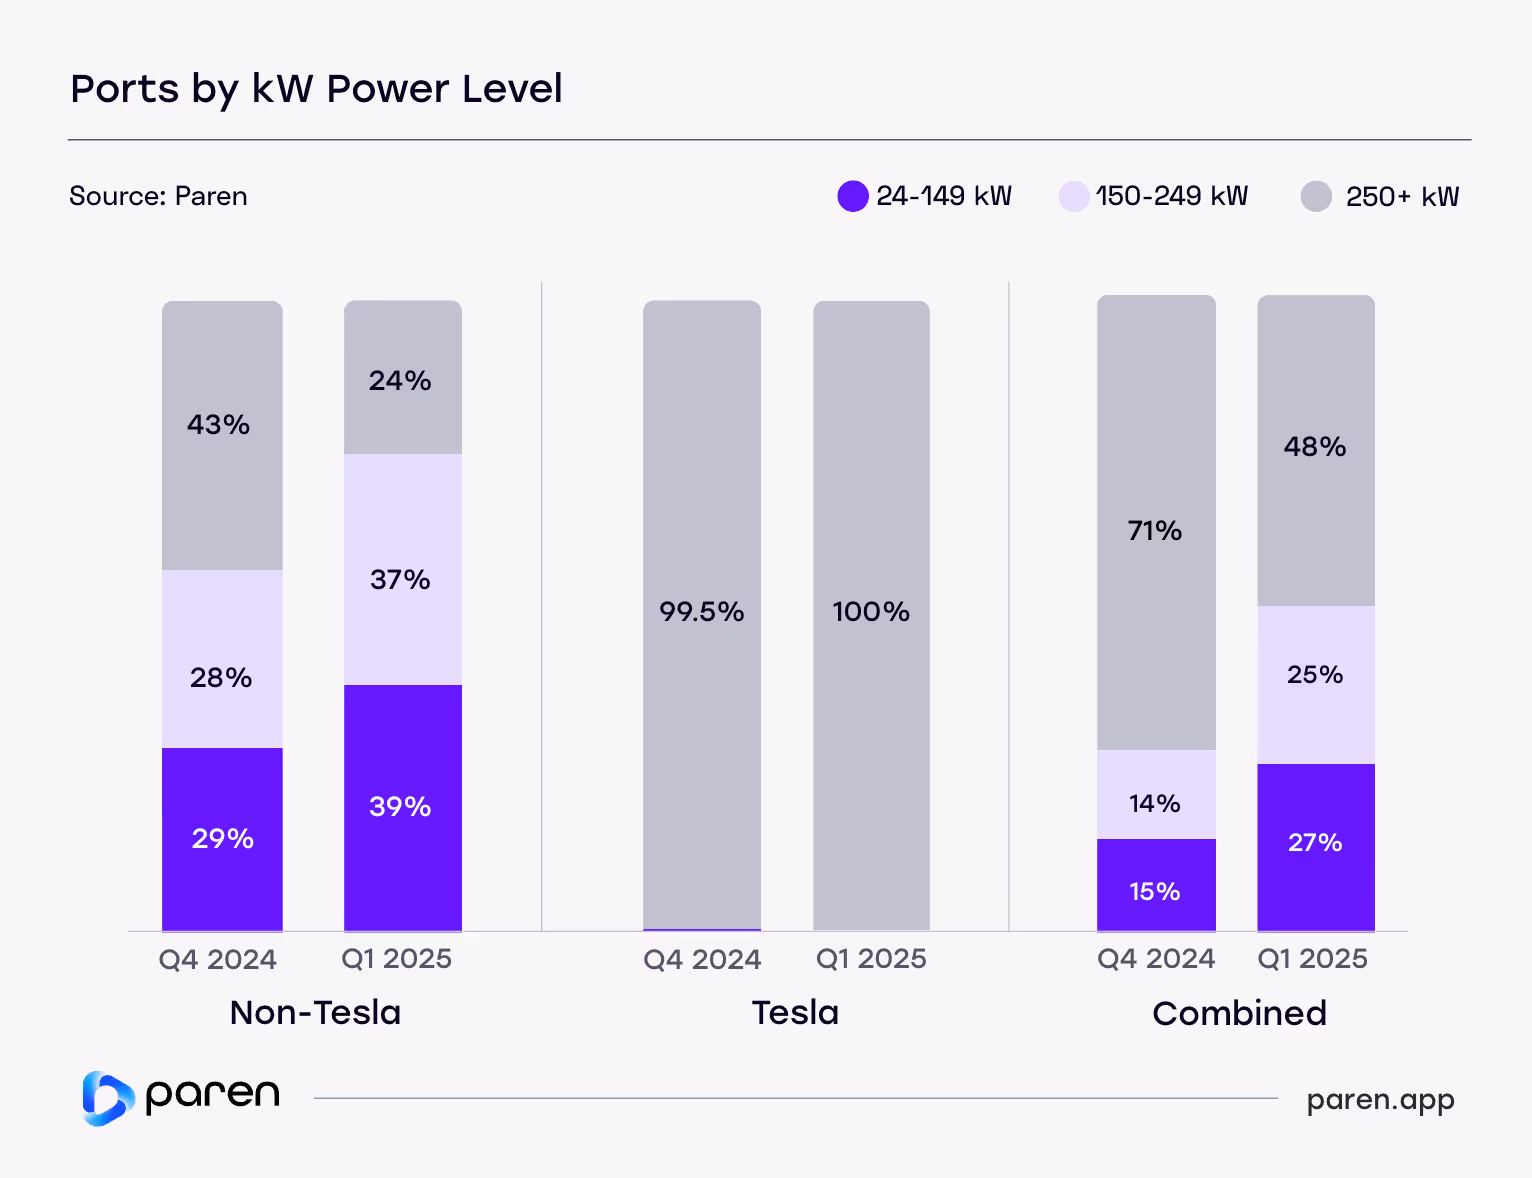
Looking at just the Tesla Supercharger network across three ranges of charger power levels, there was virtually no change during the two most recent quarters. However, across non-Tesla networks, there was a sizable increase in lower-power fast chargers in Q1 2025 versus Q4 2024.
While high-power chargers with 350/400 kW output are the focus of networks such as EVgo, Electrify America, IONNA, Mercedes-Benz HPC, Francis Energy, and Walmart—150-249 kW chargers are now becoming the defacto minimum standard among non-Tesla networks—partially due to NEVI requirements. The growth in low-power chargers (24-149 kW) in Q1 was partially driven by a large volume of chargers being deployed at auto dealerships, and ChargePoint 62 kW and 120 kW chargers at variety of location types.
Tesla Dominates NACS Ports Open to Non-Tesla EVs
The North American Charging Standard (NACS) is becoming the dominant EV charging connector, initially pioneered by Tesla and increasingly adopted by automakers and non-Tesla networks to improve accessibility and interoperability. As more automakers commit to adopting NACS, this transition is expected to accelerate industry-wide standardization. Until the majority of new non-Tesla EV models come standard with a NACS connector port, however, adapters will be necessary and available either on the charger cable, or brought by drivers.
Data from Q1 2025 shows that Tesla Superchargers overwhelmingly lead in NACS-enabled ports compared to non-Tesla networks, with 931 ports open to non-Tesla EVs, while non-Tesla networks accounted for just 104 NACS-enabled ports. For stations, the delta was much smaller with Tesla having 72 stations with NACS ports open to others, whereas non-Tesla networks had 28 stations. In total, at the end of Q1 2025, vehicles with a NACS inlet can charge at 1,035 NACS connectors located at 100 fast charging stations.
This data suggests that while non-Tesla networks are beginning to adopt NACS, the transition is still in its early stages. The disparity particularly in port numbers highlights the dominance of Tesla's network and the slower adoption pace among other networks.

Session Volume Increases Slightly During Peak Hours of the Day
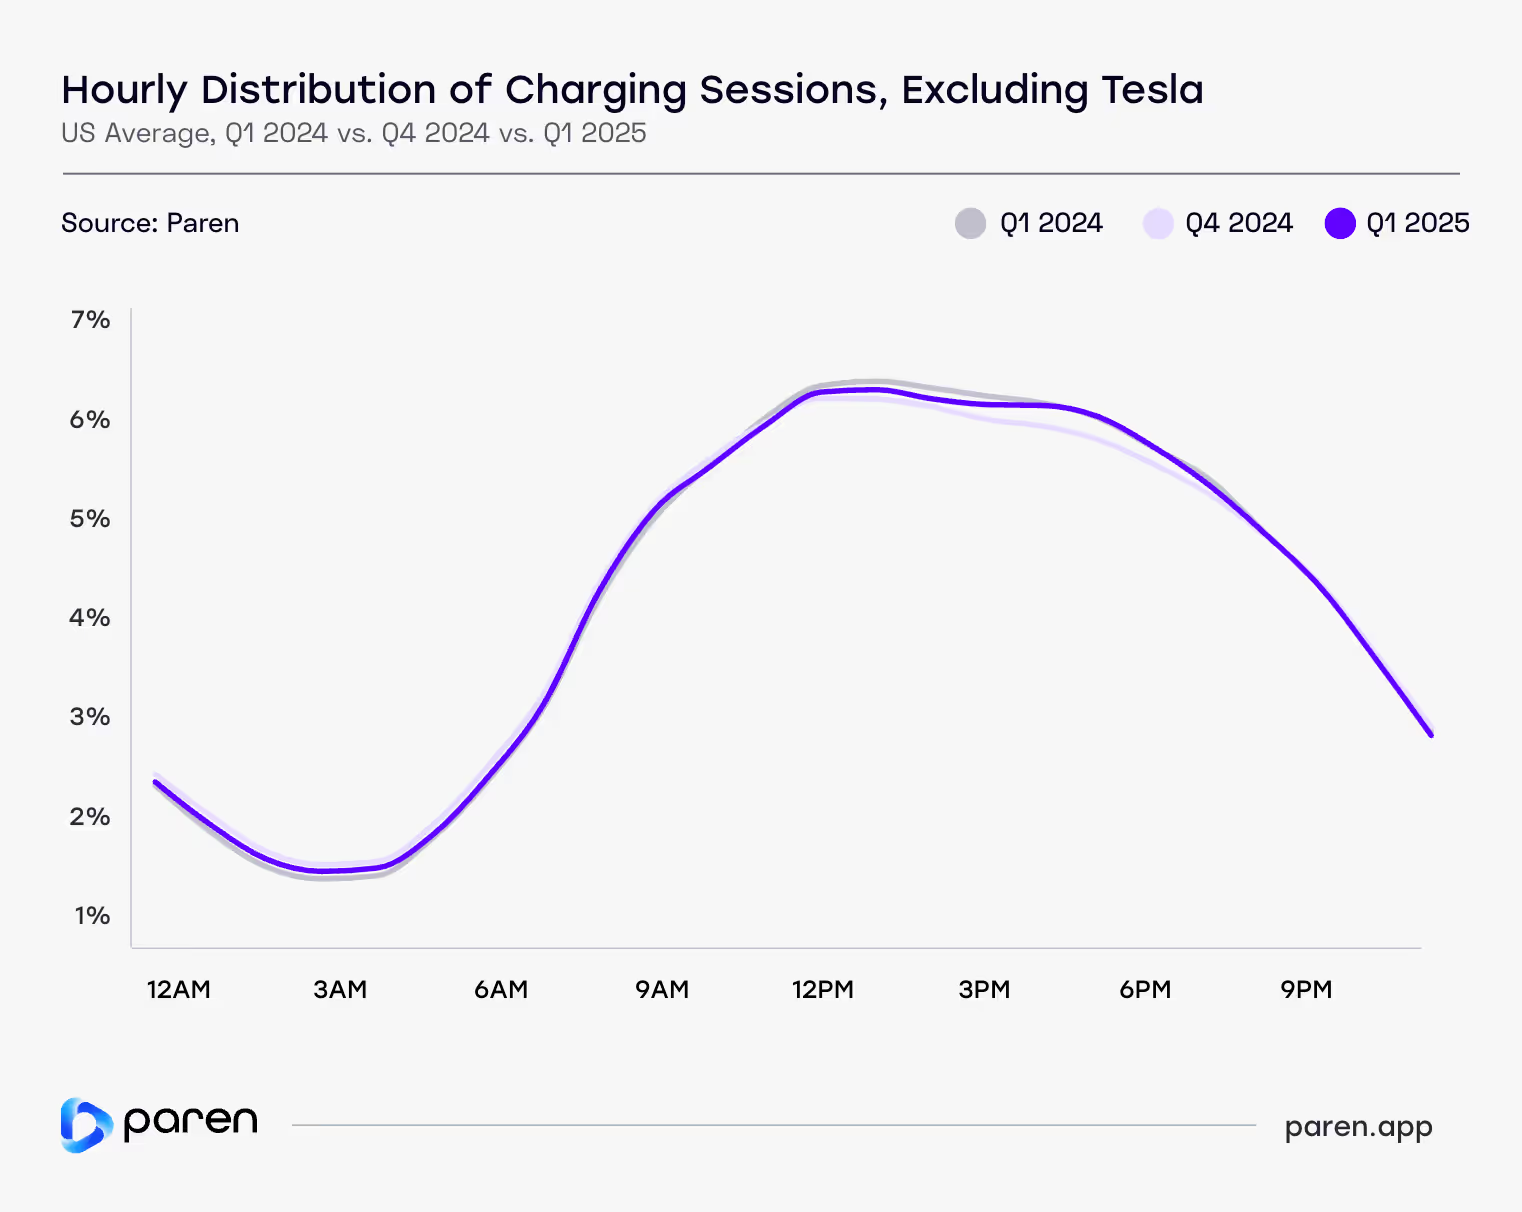
Analyzing hourly session volume patterns across non-Tesla networks reveals how public charging demand fluctuates throughout a 24-hour period. The chart reflects aggregated charging activity levels by hour block during three quarters—Q1 2024, Q4 2024, and Q1 2025.
The Y axis reflects the average session volume for each hour of the day as a percentage of a 24-hour period. In Q1 2025, charging volume increased just slightly during the period of 3pm to 7pm.
Throughout the rest of the day, session volumes as a percentage of a 24-hour period have otherwise changed little in the last year. This is not unexpected, as people's driving patterns will not change much unless an external event such as the COVID pandemic alters commuting patterns.
As CPOs see utilization reach capacity limits during peak hours, in addition to price increases and Time-of-Use (TOU) pricing—promoting off-peak charging time to fleet operators and rideshare drivers will be key to expanding revenue during low utilization hours of the day.
Understanding these patterns and variations at the station level well help CPOs make decisions around demand charge mitigation, capacity allocation, maintenance schedules, and pricing strategies.
Utilization & Reliability
DC, CA, & NJ Lead US in Q1 2025 Utilization Rates
Utilization rates* for fast-charging stations varied significantly across the U.S. in Q1 2025, with the District of Columbia (38.2%), California (23.6%), New Jersey (21.6%), and Florida (20.2%) leading the nation. These elevated rates generally reflect a combination of a large number of EVs on the road, high rideshare usage, large apartment rental population, and concentrated urban populations.
Conversely, states like South Dakota (1.1%), Montana (1.9%), and North Dakota (2.6%) have the lowest utilization—a combination of very low EV penetration, being rural markets, and very low use of rideshare services.
Understanding the differences in market composition and dynamics help spotlight where charging demand is most likely to grow the fastest in the future. A recent key driver, for example, has been the rising adoption of EVs by rideshare drivers—many of whom may charge multiple times per day, several days per week.
*Utilization rate calculated as session minutes per station as a percentage of total hours of operation per day.

Las Vegas & Miami Averaging 43% Utilization Rate During Peak Hours: 12pm-6pm
Time-based utilization has become a standard metric for measuring the growing usage and profit potential of fast charging stations. Its weaknesses, however, include that utilization (time) doesn’t precisely correlate with energy dispensed, and hence revenue (assuming pricing per kWh). And because the metric is based on the hours a station is open (typically, but not always 24 hours), lower session volumes during overnight, early morning, and late night hours can greatly reduce the high average utilization during peak hours of the day.
To partially address this, we analyzed peak-hour utilization (we chose the six-hour period of 12 noon through 6pm) and averaged the utilization rates for this period across metro areas. The intent is to better understand which markets may be nearing capacity during these "prime-time" hours.
In essence, some markets such as Las Vegas, Miami, New York, Tampa, and Los Angeles are seeing very high utilization—which is great for the profitability of CPOs—but some stations in these markets are seeing wait times and may need to add ports or deploy strategies to motivate some drivers to charge during less busy times. The standard approach is to deploy TOU rates, but the busiest stations may need to raise the highest rates during peak times even higher, and significantly lower the lowest rates.
These busy markets are likely to continue to see investment and expansion from charging networks/CPOs, while at the same time perhaps de-emphasizing expansion in the less utilized metro areas such as Columbus, San Antonio, and St. Louis. A couple of trends we may see going forward are regional and smaller networks focusing on second- and third-tier markets — but with the large national players deploying fewer port stations (e.g., 2-4 ports versus 8-12 in high-utilization markets).
A final significant variable is the impact of EV-driving rideshare drivers. In some markets, rideshare drivers are likely accounting for 40%-50% of energy throughput, so if rideshare drivers start to adopt EVs at a higher rate in lower-utilization markets, it could dramatically change the charging economics in those markets.

Las Vegas Metro Area Has the Highest US Utilization Rate in Q1 2025
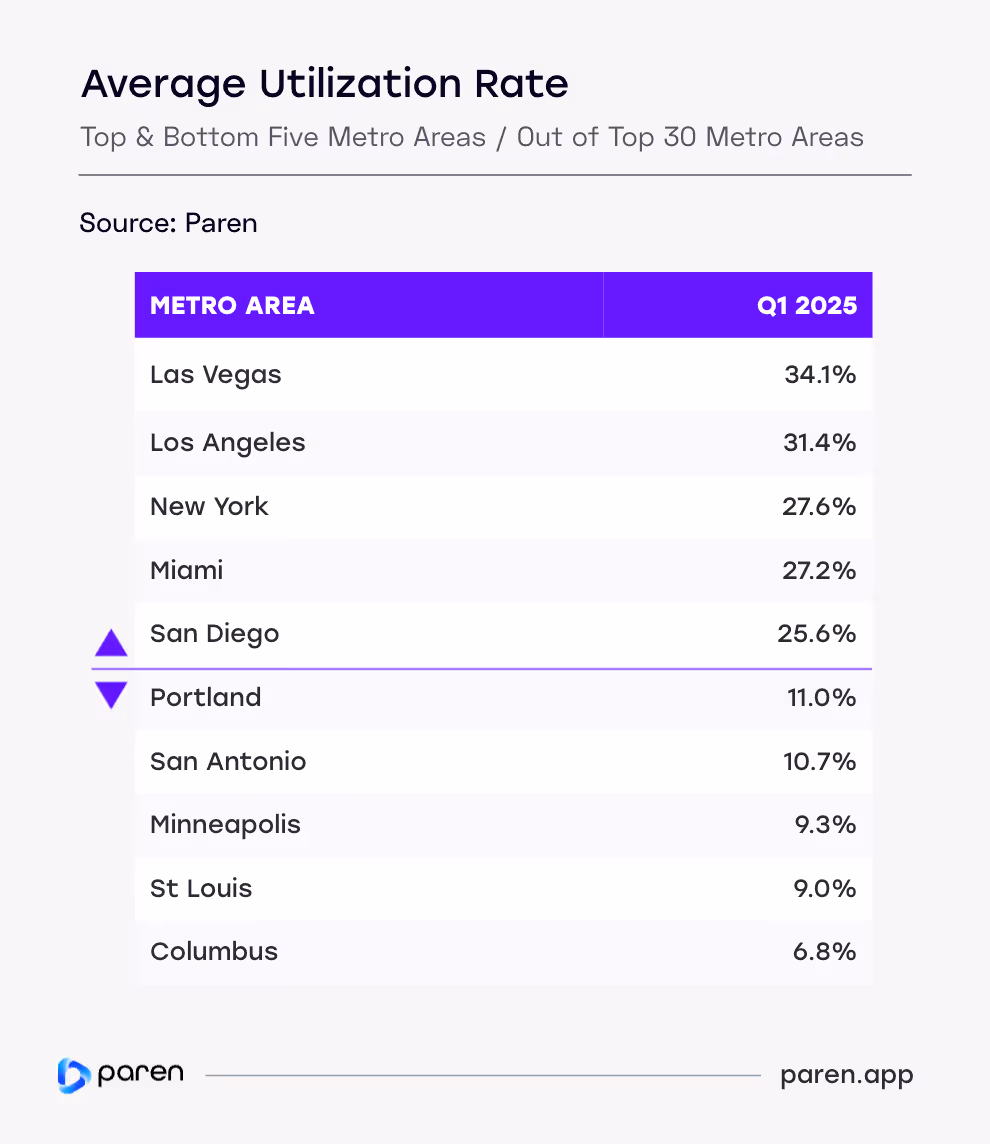
Analyzing utilization rates by MSA (Metropolitan Statistical Area)* paints a more insightful picture versus by state, but not surprisingly markets with the highest utilization rates tend to share traits including high renter population, high EV penetration, heavy rideshare usage, and are travel destinations.
Las Vegas topped the list of MSAs with an average utilization rate of 34.1%, followed by Los Angeles (31.4%), New York (27.6%), and Miami (27.2%). These high-demand regions highlight where station capacity may need to scale in the future to keep pace with usage.
On the other end of the spectrum, MSAs like Columbus (6.8%), St. Louis (9.0%), and Minneapolis (9.3%) experienced far lower utilization, signaling either excess infrastructure and/or lagging demand. This contrast reinforces the need for CPOs to implement very hyper-localized deployment strategies that match actual charging behavior, local demographics, and EV adoption patterns.
Because of low utilization and demand in rural markets and stretches of long highway corridors in some states, CPOs have tended to avoid building infrastructure in these areas. This is exactly what the National Electric Vehicle Infrastructure (NEVI) program was intended to address. Its current pause and uncertainty in the future means that many CPOs will continue to focus on medium- to high-utilization markets, resulting in concerns about being able to take long road trips by some current and potential future EV drivers.
*Metro areas included in the ranking were limited to the top 30 metros based on population.
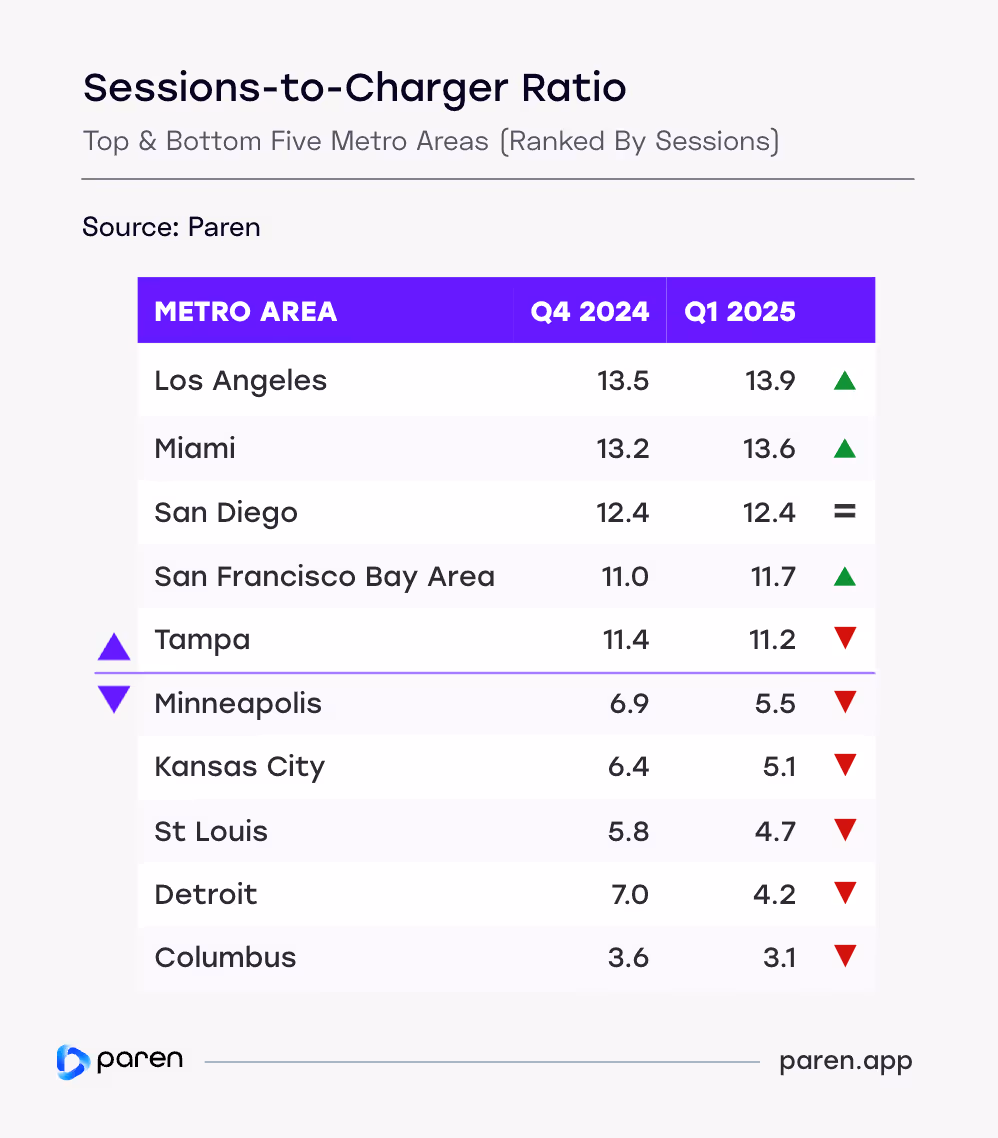
Los Angeles Has the Highest Sessions-to-Charger Ratio
The sessions-to-charger ratio serves as a key indicator of utilization pressure on fast-charging stations. Higher ratios can suggest high demand relative to available infrastructure, which may lead to congestion or wait times—especially in urban or travel-heavy corridors.
In Q1 2025, the highest sessions-to-charger ratios were in Los Angeles-Long Beach-Anaheim (13.9) and Miami-Fort Lauderdale-Pompano Beach (13.6), and San Diego (12.4). These figures reflect both high EV adoption and well-placed infrastructure in dense markets.
At the opposite end of the spectrum, several regions showed sessions-to-charger ratios that are one-half to one-third of the top MSAs. Columbus had the lowest sessions-to-charger ratio at 3.1, followed by Detroit (4.2), and St. Louis (4.7). These and similar markets may be experiencing underutilization—whether due to oversupply, geographic dispersion of chargers, or lower EV penetration.
Interestingly, the MSAs with the highest ratio saw increases or very small declines in Q1 2025 versus Q4 2024, while the MSAs with the lowest ratios tended to see fairly significant declines. While the MSAs with a high sessions-to-charger ratio are seeing high utilization they may also be reaching maximum capacity during peak hours of the day and CPOs may need to deploy tactics to drive session volume during overnight and non-peak hours of the day, and consider expanding existing stations or opening new locations.
Metro areas with low relative ratios, are markets where there is an imbalance of charger supply and demand. Unless EV sales increase significantly, stations in these markets are not likely to reach profitability for many years more than average.
Monitoring this ratio over time can help operators identify where to expand, rebalance, or defer new infrastructure based on usage patterns.
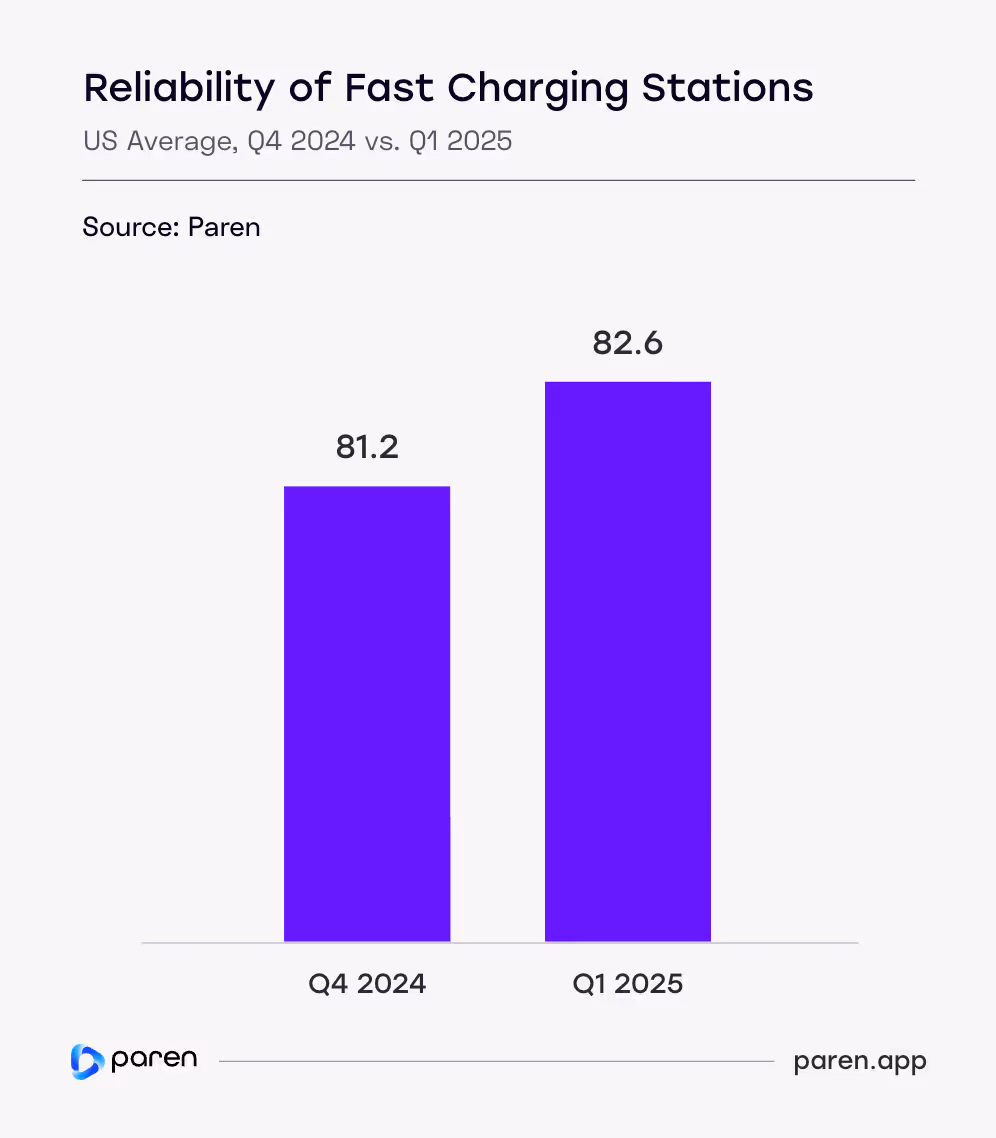
Reliability of Fast Charging Stations is on the Rise
Paren's US Reliability Index* offers a standardized view of fast charging network performance over time, capturing operational uptime and early indicators of system failure. This index helps identify how consistent and dependable public fast charging infrastructure is for US EV drivers. Paren tracks the reliability of the Tesla Supercharger network, but as it is known to be highly reliable, the index in this report will focus just on the non-Tesla networks.
In Q1 2025, the US Reliability Index saw a significant improvement versus Q4 2024 of 1.4 points to 82.6, an increase of 1.7%. This improvement, which has been a recent trend across the non-Tesla fast charging networks, suggests ongoing efforts to stabilize and improve station uptime is working. Some factors driving higher reliability include:
- In 2024, some major players slowed the opening of new fast-charging stations while they worked on improving the reliability of existing stations and assessed new and more reliable hardware options.
- Stronger performance and quality of new stations being built by major new players entering the market, and to a lesser but growing impact, new stations funded under the NEVI program.
- Maintenance programs have now become front and center, with CPOs requiring heightened SLAs with shorter response times and higher uptime.
The above shifts are part of a larger transition of the fast-charging industry from a "race to get chargers in the ground"—to a focus on a stellar charging experience and achieving profitability.
*The Reliability Index is a customer-centric metric that targets one specific outcome: Can I successfully charge at this charger? Connectors are measured on a scale of 0 to 100. In order to achieve a perfect score over the time period, a charger will have to hit first-time plug success every time and remain available when not charging with zero failed charging sessions.
Rural, Low-Utilization States Seeing Both High & Low Reliability Among "Travel Fast Charging Stations"
In Q1 2025, Idaho (92.7), Wyoming (91.7), Nevada (90.3), and Utah (89.5) were ranked the most reliable in the US across non-Tesla charging networks at "travel fast-charging stations."* Interestingly, these top ranked states shared two commonalities: being located in "Mountain" states and having a relatively small number of stations. Reasons for high reliability may be the newness of stations in these markets and with lower utilization they are seeing less driver-caused breakage and vandalism.
California, however, had the seventh-highest reliability score. With more 350 travel stations and the second-highest utilization, the state's strong showing might be because of station's very high utilization. CPOs will have local maintenance teams that can respond quickly and are financially motivated to have the highest possible uptime and availability at these "cash-cow" sites in the state.
On the flip side, travel stations in South Carolina (62.3), Alabama (68.4), Missouri (71.1), and Iowa (75.8) are seeing very poor reliability at 15-20 points below stations in the top-ranked states. These states like the top ranked "Mountain" states also have very low utilization and relatively few stations. The difference may simply be how CPOs in these states do or don't prioritize maintenance and uptime.
*Travel fast-charging stations are defined as those stations with a minimum of four ports providing 100 kW or more of simultaneous charging power.

Utah Stations Most Reliable; Oklahoma Least Reliable*
Looking at the reliability of all public fast-charging stations, in the first quarter of 2025 Utah (94.1), Alaska (93.6), Tennessee (93.4), North Carolina (93.4), and Nevada (93.2) were the top-ranked states.
While Alaska has only a handful of stations and only 3% utilization, the other three states have a relatively decent number, though utilization ranges between 9% and 14%.
Bringing up the rear are Oklahoma (70.5), South Dakota (76.2), Iowa (77.9), and Hawaii (78.3). Hawaii stations average 19% utilization, however, chargers in this island state may suffer from exposure to humidity, and perhaps CPOs that are less responsive with maintenance and the challenge of getting parts in a timely manner.
With less than a 4% utilization rate but nearly 170 stations, Oklahoma may suffer from overbuilding from Volkswagen settlement funds, resulting in poor economics and CPOs with less of a focus on reliability.
As more networks adopt proactive maintenance and software monitoring, reliability is expected to continue improving—but persistent gaps show that progress is uneven across regions.
*Includes all charging stations.

EV Charging Pricing
California Stations Have the Highest Use of Time-of-Use Rates; Montana the Lowest
Pricing models vary significantly across states, shaping how EV drivers experience and understand charging costs. This snapshot compares the top and bottom five states sorted on the percentage of stations in the state using fixed pricing. To avoid anomolies, we excluded states with 25 or fewer fast charging stations.
There are three main types of pricing used by CPOs in the US:
- Fixed pricing refers to a consistent rate per kWh for the entire day.
- TOU (Time-of-Use) pricing changes based on the time of day with higher prices during expected peak demand time. It encourages off-peak charging and can help balance grid demand.
- Time-based pricing charges by the minute or hour and is often used where energy-based pricing is restricted.
California stands out as the only major state where TOU pricing surpasses Fixed, while many states such as Oklahoma, Vermont, and Arkansas rely nearly entirely on Fixed pricing models. Fixed pricing still dominates, with an average across the states of 80.1%, followed by TOU at 15.7%, and Time at 4.2%.
In general, TOU-based pricing is used by CPOs more often in states with a combination of higher energy costs and high utilization, especially in dense urban and suburban locations. TOU rates incentivize EV drivers to charge earlier or later in the day to spread out demand and reduce congestion during peak times of the day, and also potentially lower demand charges.
Charging based on time, such as $0.45 per minute, is declining in popularity and is often used at auto dealerships and non-networked locations in states with very low EV adoption.

Hawaii Has the Highest Non-Member Average Pricing per kWh; Iowa the Lowest
The map to the right highlights the average cost per kilowatt-hour (kWh) that EV drivers pay for fast charging across the US, based on the combined Tesla and non-Tesla networks station data for non-members*.
Half of the states have an average of $0.46 to $0.51 per kWh, but some clear pricing outliers stand out. Hawaii has the highest average non-member pricing at $0.81, followed by the District of Columbia at $0.61, and Wyoming at $0.60. Iowa has the lowest at $0.39, followed by Nebraska ($0.42), North Dakota ($0.43), and Missouri ($0.43).
Not unsurprisingly, the highest prices tend to be in the West and Northeast—reflecting local energy prices, utility policies, and higher demand.
*Average prices do NOT include member discounted prices.

Travel Stations Non-Member Pricing Averages $0.54 per kWh*
This map highlights the average cost per kWh by state that non-member EV drivers pay for fast charging across Tesla and non-Tesla stations with four or more ports of 100 kW or higher.** This data highlights the average prices an EV driver would expect to pay at charging stations operated by national and regional networks that are located along highway corridors or urban and suburban retail locations.
Eighty percent of the states have average travel station prices of $0.50 to $0.59 per kWh. Iowa ($0.46), Florida ($0.46), Mississippi ($0.47), and Wisconsin ($0.47) have the lowest average prices. Vermont ($0.62), Wyoming ($0.61), and California, Hawaii, and Connecticut ($0.60) have the highest average prices.
Not unsurprisingly, there is less disparity of pricing among the larger, higher-power charging stations across the US.
*Average prices do NOT include member discounted prices.
**Alaska does not have travel stations.

No Surprise: Average Pricing per kWh is the Highest in CA MSAs
Regional price variations offer key insights into how local market dynamics, utility rates, and operator strategies impact fast charging pricing. This map highlights the average price per kWh across major US metro areas, using combined pricing data from both Tesla and non-Tesla networks for non-members. (Average prices do NOT include member discounted prices.)
The top 5 most expensive MSAs are marked in purple, with average rates at $0.55 per kWh or higher. Unsurprisingly, all five of the most expensive MSAs are in California and reflect the state's very high utility rates, demand charges, and a premium placed on high-traffic urban locations.
In contrast, the bottom 5 MSAs, shown in light purple, offer considerably lower pricing—between $0.41 to $0.45 per kWh on average. These MSAs are more geographically diverse, but benefit from lower utility electricity costs (and in Florida because of pricing from the Florida Power & Light network).

California MSAs Also Home to the Most Expensive Travel Charging Stations
This map highlights the average price per kWh across major US MSAs, using combined pricing data from both Tesla and non-Tesla networks for non-members—but just for stations with four or more ports of 100 kW or higher power. (Average prices do NOT include member discounted prices.)
The top 4 most expensive MSAs are marked in purple, with average rates at $0.60 or $0.61 per kWh, and all are located in California.
In contrast, the bottom 3 MSAs shown in light purple, offer considerably lower pricing—with Miami at $0.43, Charlotte ($0.49), and Chicago ($0.50) per kWh on average. (Five additional MSAs were tied for the next lowest prices at $0.51.) These markets with the lowest average prices are likely driven by a large concentration of Tesla Supercharger stations, modest utility rates, and strong competition for drivers.
Appendices
Appendix A
Charging Infrastructure
- CPO: Charge Point Operator.
- Fast Charging: Charging port of a minimum of 24 kW.
- NACS: North American Charging Standard; Tesla’s charging connector now adopted by many networks.
- NEVI: National Electric Vehicle Infrastructure program under the Bipartisan Infrastructure Law.
- MSA: Metropolitan Statistical Area.
- Connector: A charging plug conforming to CCS, CHAdeMO, or NACS (J3400) standard.
- Port: A charging unit with one or more connectors capable of charging one or two EVs simultaneously.
- Station: A physical location with one or more EVSEs (charging ports).
Utilization & Reliability
- Reliability Index: The Paren-specific calculation that measures charger reliability taking into account recent successful charge sessions with and without retries, failed charge attempts, and station downtime over a specific time period.
- Tesla: Tesla is a reference to the Tesla Superchargers.
- Travel Fast Charging Stations: Stations capable of charging four or more vehicles simultaneously with a minimum power level of 100kW.
- Non-Travel Fast Charging Stations: Stations with a less than four ports and providing less than 100 kW of simultaneous charging power.
- Utilization: The percentage of tracked time spent on both successful and unsuccessful charging activity at a charger over the time period open per day.
EV Charging Pricing
- Fixed Price: Refers to a consistent rate per kWh for the entire charging day.
- Time of Use (TOU): Pricing changes based on the time of day with higher prices during expected peak demand time. It encourages off-peak charging and can help balance grid demand.
- Time: Charges by the minute or hour. Often used where energy-based pricing is restricted.
Methodology Notes
- All data in this report reflects publicly available DCFC stations.
- Pricing section is based on data from Tesla, non-Tesla, and combined sources (member and non-member).
Data Sources
- AFDC+: Paren Infrastructure Dataset
- Select NEVI RFP documents and award data
- Proprietary charging session / utilization models
Appendix B
Metropolitan Statistical Areas
- Atlanta: Atlanta-Sandy Springs-Alpharetta
- Austin: Austin-Round Rock-Georgetown
- Boston: Boston-Cambridge-Newton
- Charlotte: Charlotte-Concord-Gastonia
- Chicago: Chicago-Naperville-Elgin
- Cincinnati: Cincinnati
- Columbus: Columbus
- Dallas: Dallas-Fort Worth-Arlington
- Denver: Denver-Aurora-Lakewood
- Detroit: Detroit-Warren-Dearborn
- Houston: Houston-The Woodlands-Sugar Land
- Kansas City: Kansas City
- Las Vegas: Las Vegas-Henderson-Paradise
- Los Angeles: Los Angeles-Long Beach-Anaheim
- Miami: Miami-Fort Lauderdale-Pompano Beach
- Minneapolis: Minneapolis-St Paul-Bloomington
- New York: New York-Newark-Jersey City
- Orlando: Orlando-Kissimmee-Sanford
- Philadelphia: Philadelphia-Camden-Wilmington
- Phoenix: Phoenix-Mesa-Chandler
- Portland: Portland-Vancouver-Hillsboro
- Sacramento: Sacramento-Roseville-Folsom
- San Antonio: San Antonio-New Braunfels
- San Bernardino: San Bernardino-Riverside-Ontario
- San Diego: San Diego-Chula Vista-Carlsbad
- San Francisco Bay Area: San Francisco-Oakland-Berkeley
- Seattle: Seattle-Tacoma-Bellevue
- St Louis: St Louis
- Tampa: Tampa-St Petersburg-Clearwater
- Washington: Washington-Arlington-Alexandria
Want the data behind the data?
Access utilization, reliability, and pricing at the station level across 95%+ of US and Canadian DCFC infrastructure.